Data, Trend, Market & Visualization Comparisons for Multiple Companies
Data Comparisons
Compare multiple company financial data within an industry for any financial statement, for any line item, or combination of line items. Compare companies within sectors, indexes, or custom comparisons.
Visualization Comparisons
Compare multiple company financial data visually within an industry for any line item.
Trend Comparisons
Compare multiple company financial trends within an industry for any line item, or combination of line items.
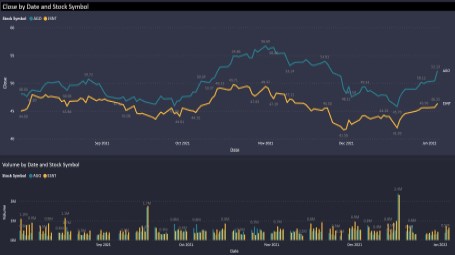
Market Comparisons
Compare multiple industry or indexcompanies to their market activity and pricing.
Comparison Variances & Percentages
Compare two companies against each other and get their variances and the percentage of the variance for any financial line items
Analyze in Excel, Export to Excel, PowerPoint of PDF
The financial statement data for the companies being compared can either be analyzed dynamically in Excel through Pivot Tables, or exported to Excel for non dynamic exploration. Data can also be exported to PowerPoint and PDF formats.