Most people cannot get their heads around SEC company financial statements and their GAAP standards, so we created a set of visualizations, dashboards, reports, forecasts and links to simplify and to quickly understand SEC company and industry data, providing actionable insights to grow your company’s revenues and profits.
We bring company data to life with stunning, interactive reports and visualizations tailored to your company and industry companies. We are committed to improving company data storytelling.
Make complex topics compelling and accessible
Company data storytelling to facts through visuals, enables you to connect with your company and industry information. Insights are shared more effectively and increase comprehension, retention, and appeal with our eye-catching visuals that help you interact and understand company data, helping to make more informed decisions quickly.
Explore company reports and data visualizations in action
Explore how data visualization transforms complicated company information into something that’s easy to share and understand.
Reports are one or more pages of interactive visuals, text, and graphics that together make up a single report. Companies can embed these reports in their own web pages.
Company SEC Reporting: Power BI, Semantic Models (Datasets), Dashboards
Maximizing Revenue Through Strategic Breakouts
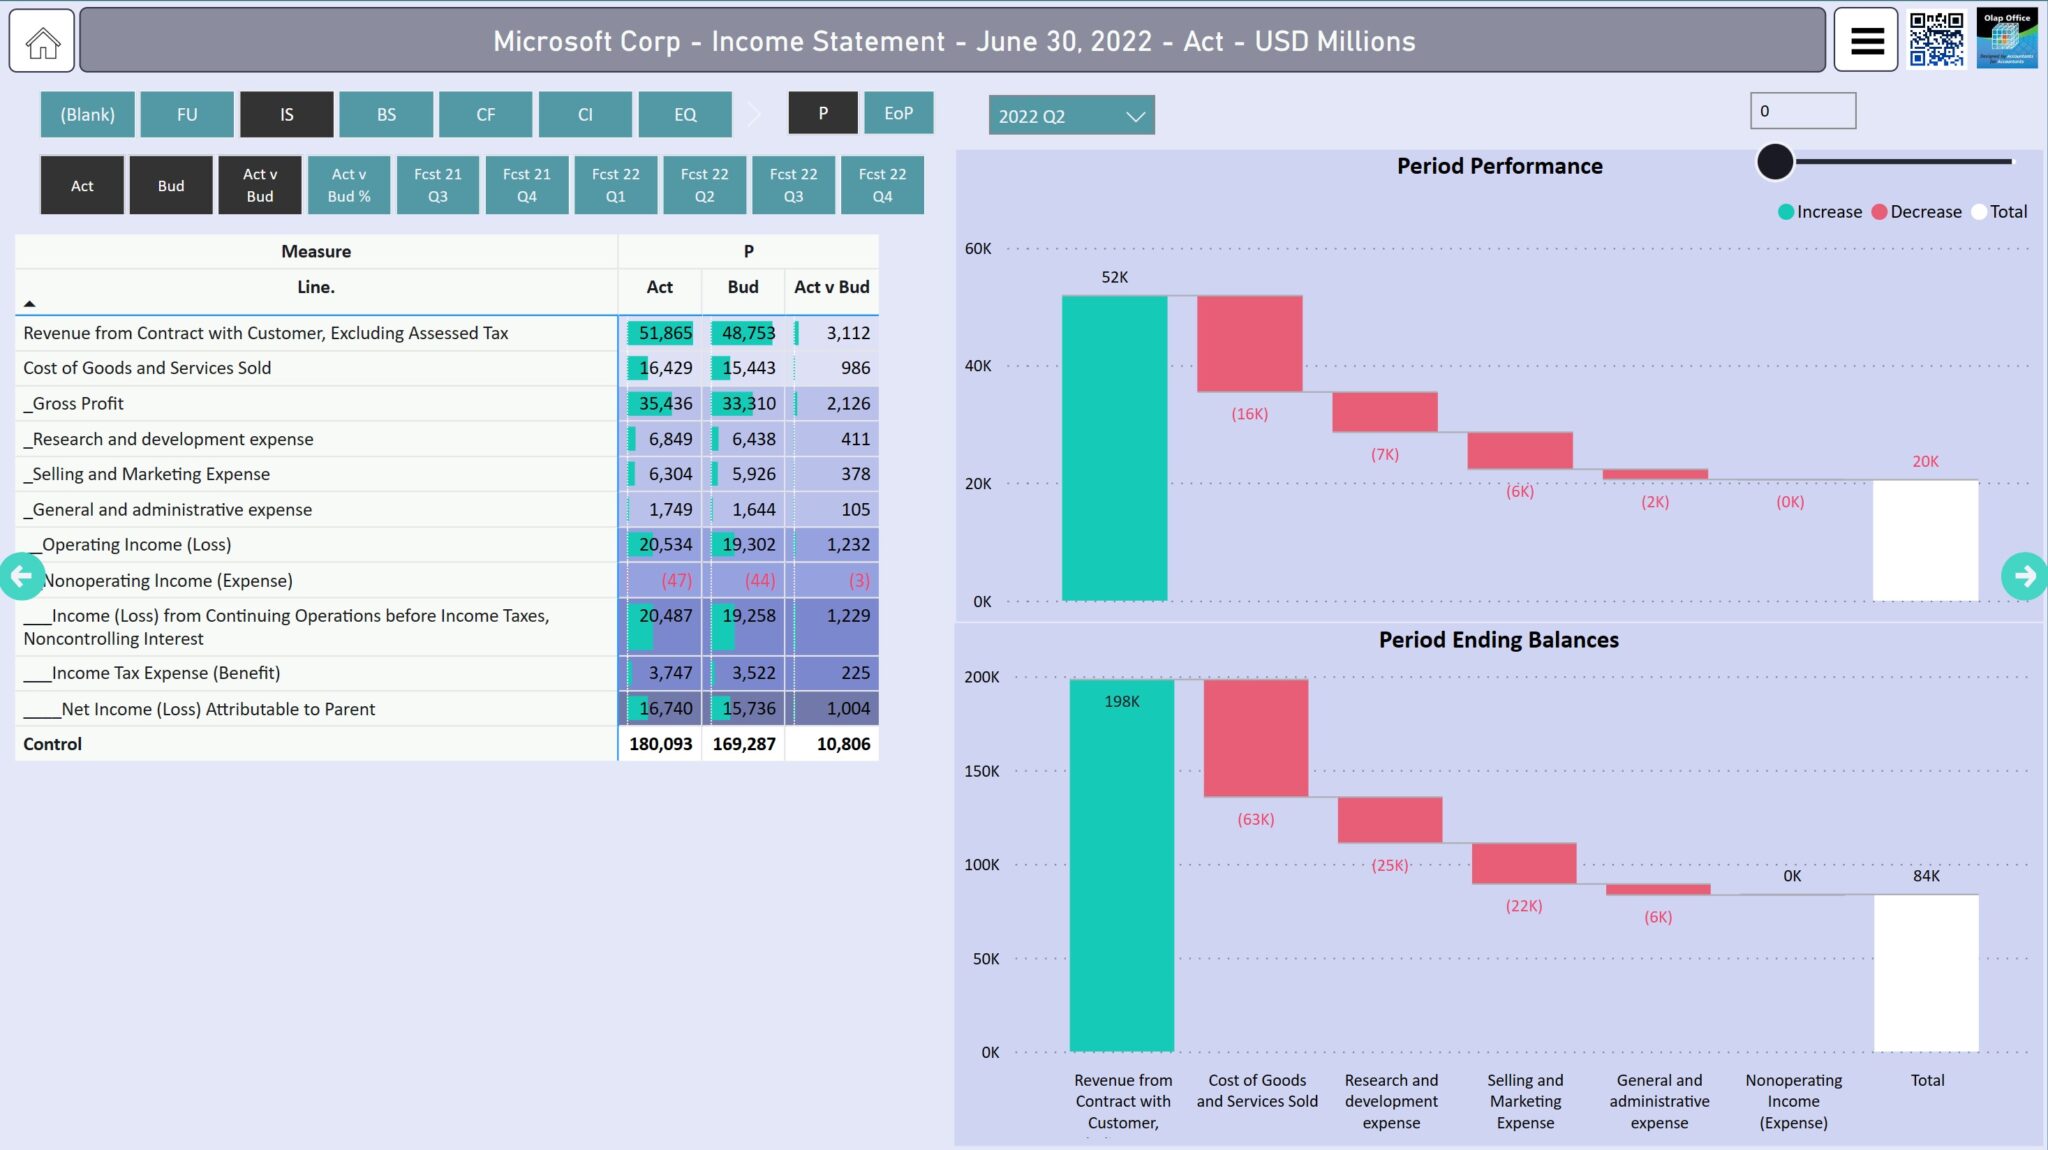
Exploring the Benefits of Visualizing Company Financial Statements
Analyzing Financial Performance: A Monthly Overview
Actuals, Budgets, Forecasts, Variance Analysis
Unlocking the Power of GAAP: Streamlining Integration & Notes Search
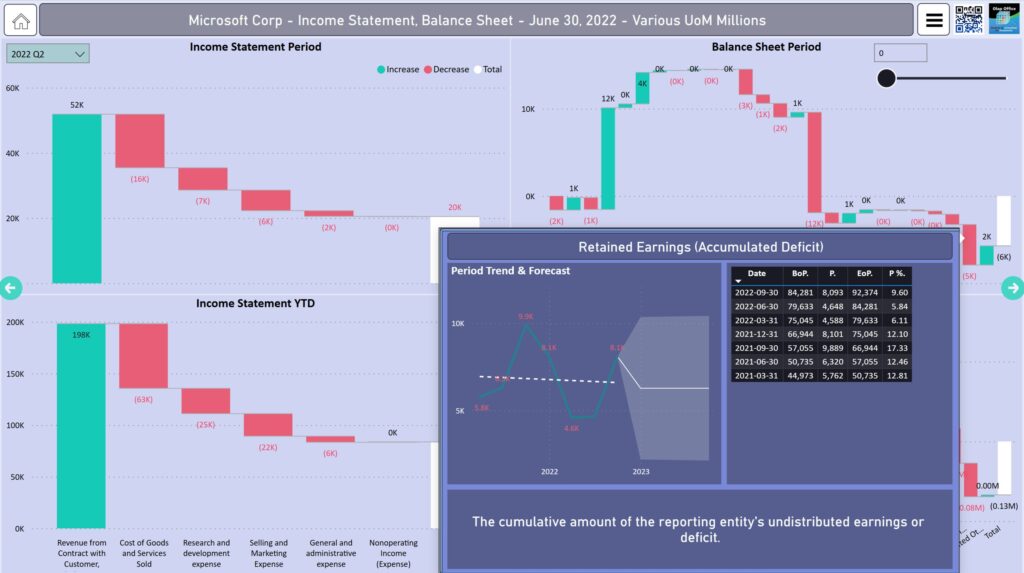
Unifying Multiple Reports into a Single Comprehensive Report
Uncovering the Insights: An Account Explanation & Trend Analysis